登录后享受更多的服务


点击第三方平台快捷登录
第三方登录方便、快捷
- 短信登录
- 邮箱登录
新用户可直接登录

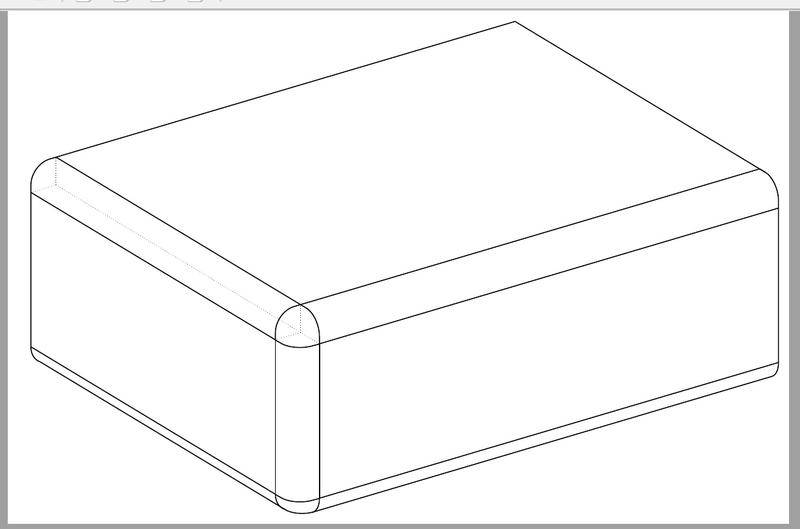
之前看到网友提出的一张图的画法,我尝试了下TIKZ的思路,旋转角r,在一定区间内变换,图形还算正常显示的。
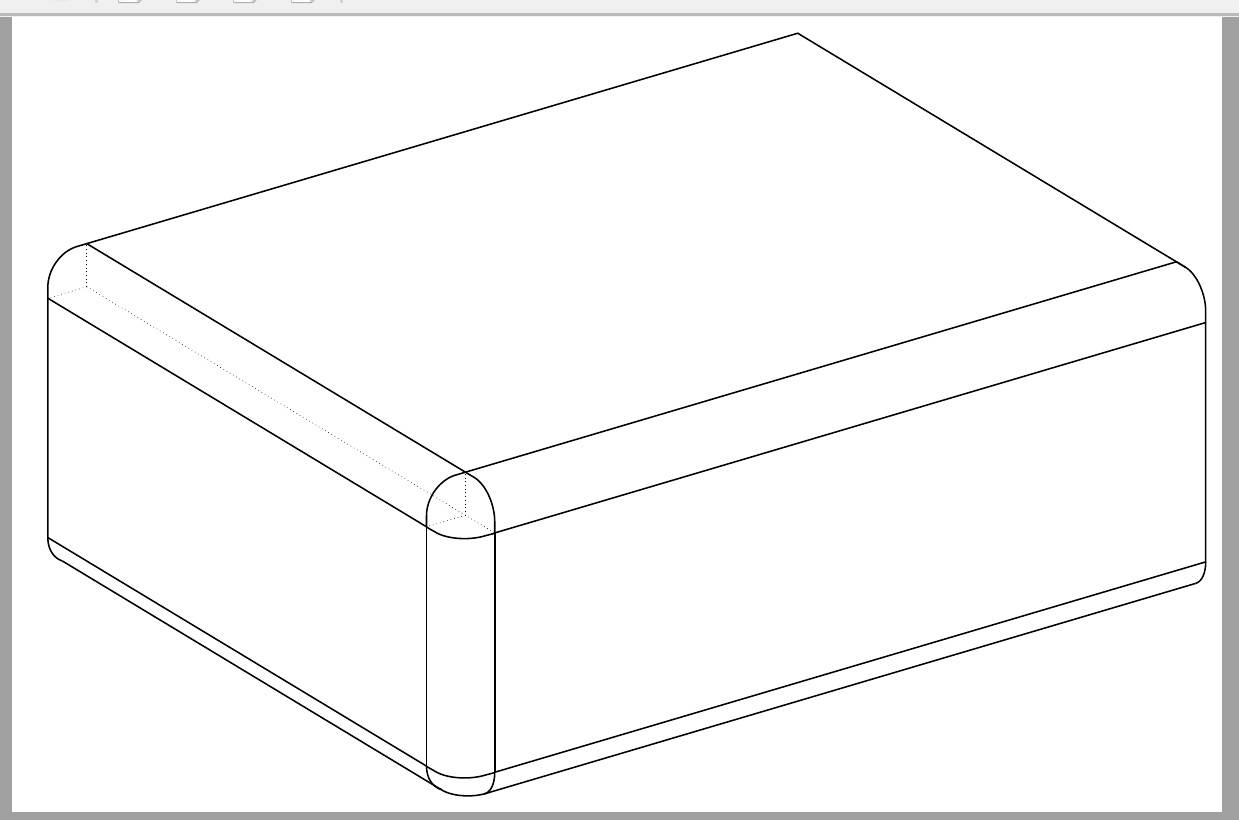
\documentclass[border=10pt]{standalone} \usepackage{tikz,amsmath} \usepackage{tikz-3dplot} \usetikzlibrary {arrows.meta} \begin{document} \def\r{55} \tdplotsetmaincoords{65}{\r} \begin{tikzpicture}[scale=1,tdplot_main_coords] \def\r{0.8} \def\h{8} %\draw[arrows = {-Stealth[inset=0pt, length=10pt, angle'=30]}] (0,0,0) -- (12,0,0) node[anchor=north east,font=\fontsize{200}{0}\selectfont]{$X$}; %\draw[arrows = {-Stealth[inset=0pt, length=10pt, angle'=30]}] (0,0,0) -- (0,20,0) node[anchor=north west,font=\fontsize{200}{0}\selectfont]{$Y$}; %\draw[arrows = {-Stealth[inset=0pt, length=10pt, angle'=30]}] (0,0,0) -- (0,0,12) node[anchor=south,font=\fontsize{200}{0}\selectfont]{$Z$}; \foreach \i in {0,15} { \draw[black,,line width=1pt](\i,-\r,-0.36*\r+8)--plot [shift={(\i,0,\h)},domain=270:360, samples=20,smooth] (0,{\r*(sin(\x)},{\r*(cos(\x)})--(\i,0.36*\r,\r+8);} %%% \draw[line width=1pt] (0,0.28,\h+\r) -- (0,20,\h+\r)-- (15.36,20,\h+\r); \draw[dotted] (0,0.28,-0.28+\h) -- (15.36+\r,0.28,-0.28+\h); \draw[dotted] (0,0.28,-0.28+\h) -- (0,0.28,\h+\r); \draw[dotted] (0,0.28,-0.28+\h) -- (0,-\r,-0.28+\h); \draw[dotted] (15,0.28,-0.28+\h) -- (15,0.28,\h+\r); \draw[dotted] (15,0.28,-0.28+\h) -- (15,-\r,-0.28+\h); \draw[line width=1pt] (0,0.28,\h+\r) -- (15,0.28,\h+\r); \draw[line width=1pt] (0,-\r,-0.28+\h) -- (15,-\r,-0.28+\h); \foreach \j in {0.28,20} { \draw[black,,line width=1pt](15.36+\r,\j,-0.36*\r+8)--plot [shift={(15.36,\j,\h)},domain=0:90, samples=20,smooth] ({\r*(cos(\x)},0,{\r*(sin(\x)})--(15,\j,\r+8);} \draw[line width=1pt] (15,0.28,\h+\r) -- (15,20,\h+\r); \draw[line width=1pt] (15.36+\r,0.28,-0.28+\h) -- (15.36+\r,20,-0.28+\h); %\draw[black,,line width=1pt]plot [shift={(15.36,10,\h)},domain=0:90, samples=20,smooth] ({\r*(cos(\x)},0,{\r*(sin(\x)}); \foreach \k in {0,-6} { \draw[black,,line width=1pt](15.36+\r,0.28,-0.36*\r+8+\k) --plot [shift={(15.36,0,-0.28+\h+\k)},domain=90:180, samples=20,smooth] ({\r*(sin(\x)},{\r*(cos(\x)},0)--(15,-\r,-0.36*\r+8+\k);} \draw[line width=1pt] (15,-\r,-0.28+\h) -- (15,-\r,-0.28+\h-6); \draw[line width=1pt] (15.36+\r,0.28,-0.28+\h) -- (15.36+\r,0.28,-0.28+\h-6); \draw[line width=1pt] (15.36+\r,20,-0.28+\h) -- (15.36+\r,20,-0.28+\h-6)-- (15.36+\r,0.28,-0.28+\h-6); \draw[line width=1pt] (0,-\r,-0.28+\h) -- (0,-\r,-0.28+\h-6)-- (15,-\r,-0.28+\h-6); \foreach \i in {0,15} { \draw[black,line width=1pt]plot [shift={(\i,0,\h-6.28)},domain=210:270, samples=20,smooth] (0,{\r*(sin(\x)},{\r*(cos(\x)});} \foreach \j in {0.28,20} { \draw[black,line width=1pt]plot [shift={(15.36,\j,\h-6.28)},domain=300:360, samples=20,smooth] ({\r*(cos(\x)},0,{\r*(sin(\x)});} \draw[line width=1pt] (0,{-\r*cos(60)},{(\h-6.28)-\r*sin(60)}) -- (15,{-\r*cos(60)},{(\h-6.28)-\r*sin(60)}); \draw[line width=1pt] ({15.36+\r*sin(30)},0.28,{(\h-6.28)-\r*cos(30)}) -- ({15.36+\r*sin(30)},20,{(\h-6.28)-\r*cos(30)}); \draw[black,line width=1pt] plot [domain=84:188, samples=20,smooth] ({15.05+0.888*\r*(sin(\x)},{0.312+0.888*\r*(cos(\x)},1.027);% \end{tikzpicture} \end{document}
LaTeX Online Code Snippets-Copyright©2019版权所有 浙ICP备2020033727号 ![]() 浙公网安备3310902000919号
浙公网安备3310902000919号


暂无评论