TikZ 原生函数作图
这里举一个例子,原生 TikZ 作图使用到的命令是 \draw [options] plot (\x,{function(\x)});,比如反函数与正弦函数的函数作图命令如下,其中需要注意的是:默认的,TikZ 使用的是度数,而不是弧度,如果需要使用弧度作图,应该在三角函数内加个弧度转化的标注,比如本例中的sin(\x r)。
\documentclass[tikz,border=4pt]{standalone}

\usepackage{mathpazo}
\newcommand*{\num}{pi}
 % define the plot style and the axis style
\tikzset{elegant/.style={smooth,thick,samples=50,cyan}}
\tikzset{eaxis/.style={->,>=stealth}}

\begin{document}

\begin{tikzpicture}
     % draw the axis
    \draw[eaxis] (-\num,0) -- (\num,0) node[below] {$x$};
    \draw[eaxis] (0,-\num) -- (0,\num) node[above] {$f(x)$};
     % draw the function (piecewise)
    \draw[elegant,domain=-\num:-1/\num] plot(\x,{1/\x});
    \draw[elegant,domain=1/\num:\num] plot(\x,{1/\x});
    \draw[elegant,orange,domain=-\num:\num] plot(\x,{sin(\x r)});
\end{tikzpicture}

\end{document}
其中,在实际应用中,我发现 TikZ 函数作图存在某些问题
当作图范围变大的时候(比如成百上千),经常遇到范围过大的提示,然后就需要手动修改缩放(X 轴缩放与 Y 轴缩放),这个调整起来还是不方便的。
如果遇到函数作图有明显的错误,请把 PGF 升级或者使用 TeXlive 2014,我在 TeXlive 2013 的时候就遇到了明显的 bug,换到 2014 之后,注意把中间文件删除之后再编译。
TikZ 与 pgfplots 结合
While tikz can do basic graphs, it is more of drawing package than a graphing package. For graphs, I would recommend you use the pgfplots package, which internally uses tikz to do the actual drawing. To use pgfplots you invoke the axis environment.
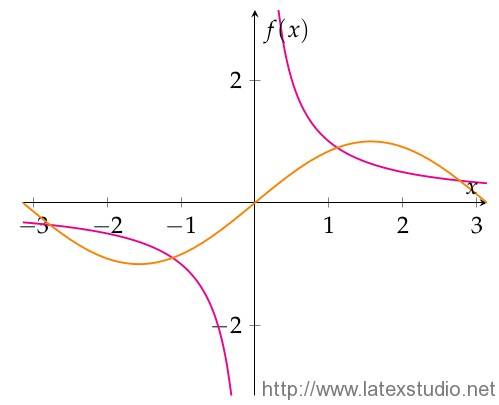
我们使用 pgfplots 宏包画函数图会方便很多,上面说到的范围过大的问题也不会存在;pgfplots 提供我们一个 axis 环境,下面给出一个例子:
\documentclass[border=4pt]{standalone}

\usepackage{mathpazo}
\usepackage{pgfplots}
\newcommand{\num}{pi}
\pgfplotsset{compat=1.8}
 % define the plot style and the axis style
\tikzset{elegant/.style={smooth,thick,samples=50,magenta}}

\begin{document}

\begin{tikzpicture}
    % the axis environment
    \begin{axis}[axis x line=middle,
                 axis y line=middle,
                 ylabel=$f(x)$,
                 xlabel=$x$]
        \addplot[elegant,domain=-\num:-1/\num]{1/x};
        \addplot[elegant,domain=1/\num:\num]{1/x};
        \addplot[elegant,orange,domain=-\num:\num]{sin(deg(x))};
    \end{axis}
\end{tikzpicture}

\end{document}
注意事项:
pgfplots 没有
sin(\x r)这种写法,而是使用deg(x)将x识别为弧度。addplot命令可以为我们创建分段函数,只要确定不同的定义域(参数domain),设定不同的函数即可。默认地,pgf 并不把坐标系建在原点,为了更符合我们的习惯,需要用到两个选项:
axis x line=middleaxis y line=middle
TikZ 与 Gnuplot 结合
在介绍怎么使用 TikZ 与 Gnuplot 之前,我们先说怎么编译。在 TeX 发行里,Gnuplot 并不包含在内。它的原理是 TikZ 调用 Gnuplot 之后,在编译的过程中,我们将会得到两个中间文件
filename.pgf-plot.gnuplot
filename.pgf-plot.table
其中,前者是 pgf-plot.table 的设定文件,而后者就是调用 Gnuplot 之后产生的一个数据表(点的坐标),然后 TikZ 调用这些点的坐标得到函数图。
为了能够使用 TikZ 与 Gnuplot,需要做两件事
在电脑安装 Gnuplot
编译的时候加参数
--shell-escape,比如使用命令行编译:pdflatex --shell-escape filename.tex
这里举两个简单的例子(注意,下面两个例子都需要使用到 Gnuplot 的方式):
\documentclass[tikz]{standalone}

\usepackage{mathpazo}
\usepackage{tkz-fct}

\begin{document}

\begin{tikzpicture}[>=stealth']
    \tkzInit[xmin=-20,xmax=30,
             ymin=-350,ymax=50,
             xstep=10,ystep=100]
    \tkzAxeXY
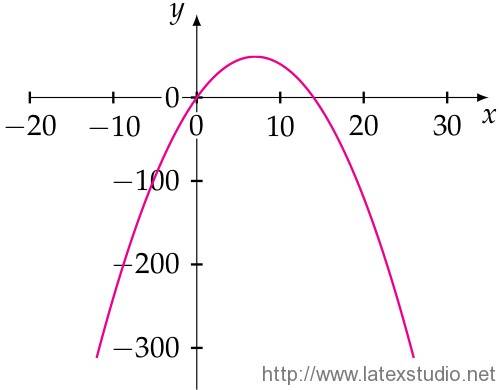
    \tkzFct[domain=-12:26,color=magenta,thick]{14*\x-\x**2}
\end{tikzpicture}

\end{document}
这个例子用到了 tikz-fct 这个宏包,这个宏包的重要缺陷是目前还没有英文版的手册,只有法文的手册。
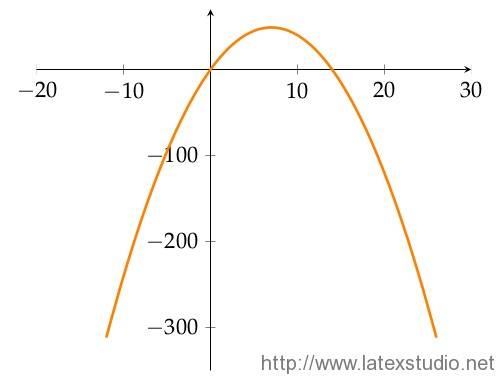
由于上面的宏包没有英文版的手册,我们也只能看看别人的例子,麻烦的不是我们画不出函数图,而是我们没法进行进一步的修饰,如果对 tikz-fct 有兴趣可以去看下 CTAN 上的文档说明,下面给出 Gnuplot + pgfplots 结合的方法:
\documentclass[border=4pt]{standalone}

\usepackage{mathpazo}
\usepackage{pgfplots}
\pgfplotsset{compat=1.8}

\begin{document}

\begin{tikzpicture}
    \begin{axis}[axis x line = middle,
                 axis y line = middle,
                 xmin=-20,xmax=30,
                 ymin=-350,ymax=70]
    \addplot[domain=-12:26,color=orange,very thick,smooth] gnuplot {14*x-x^2};
    \end{axis}
\end{tikzpicture}

\end{document}注意事项:
区别在于我们用到了
gnuplot,所以编译的时候不要忘了--shell-escape选项如果编译过一次,而用到的坐标点没有改变,可以不需要加选项编译。
函数的写法和 pgfplots 没有区别,区别在于点的获取。
函数绘图实例
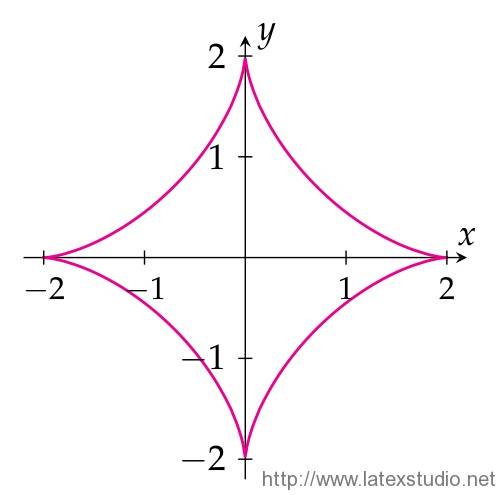
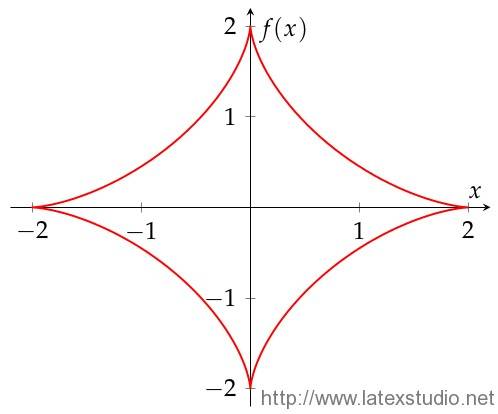
如何画出 x^(2/3) + y^(2/3) = a^(2/3) 的函数图像?其中 a=2。
原生 TikZ 代码实现代码:
\documentclass[tikz,border=3pt]{standalone}

\usepackage{mathpazo}
\newcommand{\num}{2.2}
 % define the style elegant
\tikzset{elegant/.style={domain=-2:2,thick,samples=201,magenta,line cap=rect,line join=bevel}}


\begin{document}

\begin{tikzpicture}[>=stealth]
    % draw the axis
    \draw[->] (-\num,0) -- (\num,0) node[above] {$x$};
    \draw[->] (0,-\num) -- (0,\num) node[right] {$y$};
    % draw the part above of x axis
    \draw[elegant] plot (\x,{(2^(2/3) - (abs(\x))^(2/3) )^(3/2)});
    % draw the part below of x axis
    \draw[elegant] plot (\x,{-(2^(2/3) - (abs(\x))^(2/3) )^(3/2)});
    \foreach \x/\xtext in {-2/-2, -1/-1, 1/1, 2/2}
    \draw[shift={(\x,0)}] (0pt,2pt) -- (0pt,-2pt) node[below] {\small $\xtext$};
     \foreach \y/\ytext in {-2/-2, -1/-1, 1/1, 2/2}
    \draw[shift={(0,\y)}] (2pt,0pt) -- (-2pt,0pt) node[left] {$\ytext$};
\end{tikzpicture}

\end{document}注意事项:
line cap 有三种,分别是:round,butt,rect,区别参看:line cap
line join 有三种,分别是:miter,bevel,round,区别参看:line join
这里用到了
abs取x的绝对值,如果不使用将缺少一半,原因不太清楚。samples取样点奇数与偶数有点小差别,视情况选择奇数或者偶数,在这里选择奇数samples=201。
pgfplots+参数方程 实现代码(源于 Peter Grill)
\documentclass[border=3pt]{standalone}

\usepackage{mathpazo}
\usepackage{pgfplots}% This uses tikz
\pgfplotsset{compat=newest}% use newest version

\newcommand*{\A}{2}
\newcommand*{\num}{2.2}

 % X 的参数方程
\pgfmathdeclarefunction{SolutionX}{1}{%
    \pgfmathparse{\A*(cos(deg(\t)))^3}%
}

 % Y 的参数方程
\pgfmathdeclarefunction{SolutionY}{1}{%
    \pgfmathparse{\A*(sin(deg(\t)))^3}%
}

 % define elegant style
\tikzset{elegant/.style={smooth, red, thick, samples=101}}

\begin{document}

\begin{tikzpicture}
    \begin{axis}[axis lines=middle,
                 xmin=-\num, xmax = \num,
                 ymin=-\num, ymax = \num,
                 ylabel=$f(x)$,
                 xlabel=$x$]
        \addplot[elegant,variable=\t, domain=-2*pi:0]
            ({SolutionX(\t)},{SolutionY(\t)});
    \end{axis}
\end{tikzpicture}

\end{document}
注意事项:
使用
pgfmathdeclarefunction并不是必须的, 这样写更方便理解。如果遇到无界(infty)的情况,可以使用下面的两个选项之一,区别在于,前者有提示信息,后者没有。
unbounded coords=discardunbounded coords=jump有时候可能需要对方程进行变形。
pgf使用的是度数,而不是弧度,可以使用deg函数“识别”为弧度。在使用参数方程的时候,
variable=\t语句是不能少的。
函数绘图扩展
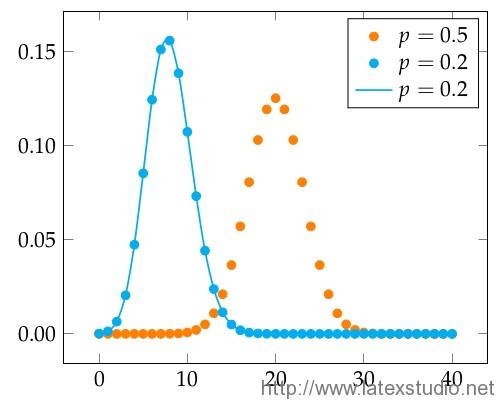
可能有些函数在 TikZ 的数学引擎(math engine)中并没有定义,用户可以自己定义,然后通过绘图函数将其绘制出来。比如这里考虑伯努利概率函数(二项分布),定义函数使用到的命令是
declare function={binom(\k,\n,\p)=\n!/(\k!*(\n-\k)!)*\p^\k*(1-\p)^(\n-\k);}有了函数然后可以像已经定义过的函数一样使用。下面是全部的代码(源于:Jake):
\documentclass[border=5pt]{standalone}

\usepackage{mathpazo}
\usepackage{pgfplots}
\pgfplotsset{compat=1.8}

 % define the binom function
\tikzset{declare function={
            binom(\k,\n,\p)=\n!/(\k!*(\n-\k)!)*\p^\k*(1-\p)^(\n-\k);
            }
        }

\begin{document}

\begin{tikzpicture}
    \begin{axis}[samples at={0,...,40},
                 yticklabel style={
                   /pgf/number format/fixed,
                   /pgf/number format/fixed zerofill,
                   /pgf/number format/precision=2}
                ]
        \addplot [only marks,orange] {binom(x,40,0.5)};
        \addlegendentry{$p=0.5$}
        \addplot [only marks,cyan] {binom(x,40,0.2)};
        \addlegendentry{$p=0.2$}
        \addplot [smooth,thick,cyan] {binom(x,40,0.2)};
        \addlegendentry{$p=0.2$}
    \end{axis}
\end{tikzpicture}

\end{document}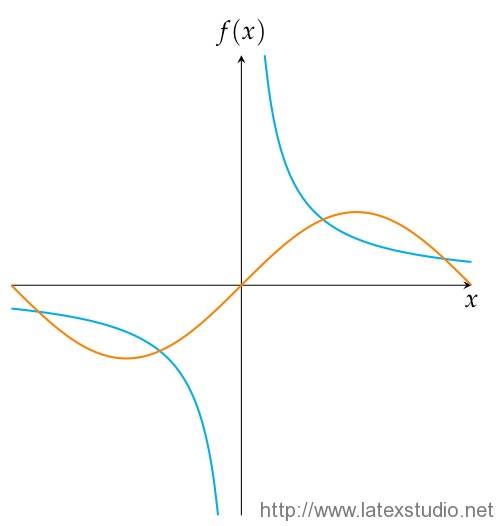


tikz基本语法哪里有介绍呀
666