TikZ 初步实现
Caramdir 提供了一种方法,就是将插图命令放在 node 中,然后在上面画图,其中图片的左下角为坐标系的原点,坐标系为绝对坐标(与 TikZ 中坐标一致),代码如下:
\begin{tikzpicture}
    \node[anchor=south west,inner sep=0] at (0,0) {\includegraphics[width=\textwidth]{some_image.jpg}};
    \draw[red,ultra thick,rounded corners] (7.5,5.3) rectangle (9.4,6.2);
\end{tikzpicture}
这个方法虽然用简单的命令就实现了我们想要的需求,但是却有两个非常伤的缺点:
作图命令用到的点的坐标怎么定?一点一点尝试修改?
如果我们对图片进行了缩放(横向、纵向缩放),我们之前的坐标也不准确了。
更进一步
Caramdir 为了解决第二个问题提出了如下方法:
\begin{tikzpicture}
    \node[anchor=south west,inner sep=0] (image) at (0,0) {\includegraphics[width=0.9\textwidth]{some_image.jpg}};
    \begin{scope}[x={(image.south east)},y={(image.north west)}]
        \draw[red,ultra thick,rounded corners] (0.62,0.65) rectangle (0.78,0.75);
    \end{scope}
\end{tikzpicture}
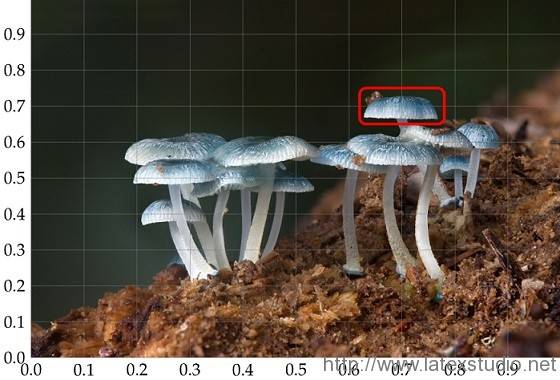
也就是新建了一个相对坐标系,图片的左下角(sourth west)为坐标原点 (0,0),图片的右上角(north east)为 (1,1),这样我们在引用图片上的点就可以用相对坐标了,缩放对坐标并不影响标记点所在位置。
在这样的处理下,第一个仍然没有解决。
TikZ 完美方案
为解决在图片上确定点坐标的问题,Jake 提出了非常机智的解决方案,在图片上画网格线,在我们插图之后把相对坐标系彻底画出来,这样,对于上面的某个点我们不再需要一点点修改,Jake 的代码如下:
\draw[help lines,xstep=.1,ystep=.1] (0,0) grid (1,1);
\foreach \x in {0,1,...,9} { \node [anchor=north] at (\x/10,0) {0.\x}; }
\foreach \y in {0,1,...,9} { \node [anchor=east] at (0,\y/10) {0.\y}; }我们使用网络上的一张图片作为样图(Mycena_interrupta.jpg),结合之前 Caramdir 的方法,最终的完整代码如下:
 %!TEX program = pdflatex

\documentclass[tikz]{standalone}

\usepackage{mathpazo,graphicx}

\begin{document}

\begin{tikzpicture}
    % 引入图片
    \node[anchor=south west,inner sep=0] (image) at (0,0) {\includegraphics[width=0.9\textwidth]{Mycena_interrupta.jpg}};

    \begin{scope}[x={(image.south east)},y={(image.north west)}]
        % 建立相对坐标系
        \draw[help lines,xstep=.1,ystep=.1] (0,0) grid (1,1);
        \foreach \x in {0,1,...,9} { \node [anchor=north] at (\x/10,0) {0.\x}; }
        \foreach \y in {0,1,...,9} { \node [anchor=east] at (0,\y/10) {0.\y}; }
        % 作图命令
        \draw[red, ultra thick, rounded corners] (0.62,0.65) rectangle (0.78,0.75);
    \end{scope}
\end{tikzpicture}

\end{document}


发表评论 取消回复