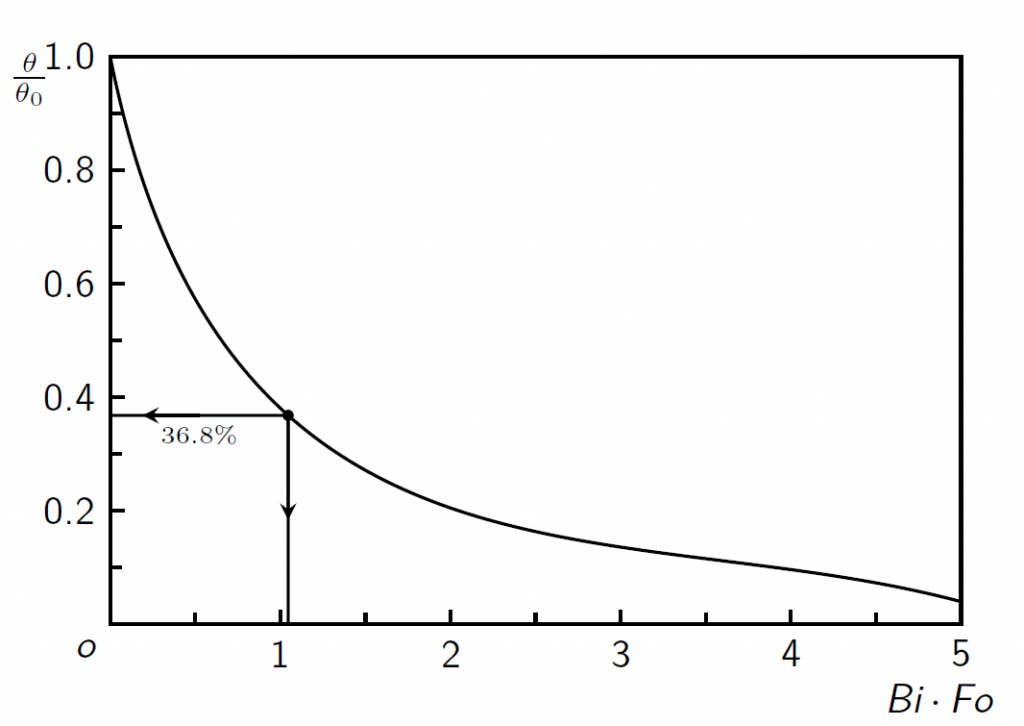
很多用户tikz入门的时候,总觉得命令比较繁琐,后续我们将整理比较好的例子供大家学习和借鉴,下文给出了绘制坐标系简单样例:
效果图:
 代码如下:
代码如下:
%传热学图3-5
\documentclass{article}
\usepackage{tikz,pgf}
\usepackage{amsmath}
\usetikzlibrary{calc}
\usetikzlibrary{intersections,decorations.markings}
\begin{document}
%传热学图3-5
{\centering \small %
\begin{tikzpicture}[>=stealth,scale=1,line width=0.8pt]
\useasboundingbox[draw](-1,-1) rectangle(9,6);
% % % % % % % % % % % % % % %
\pgfmathsetmacro{\ticker}{0.125} %ticker的长度
%画一个矩形
\coordinate [label=225:$o$](A) at (0,0);
\coordinate (B) at (0,5);
\coordinate (C) at (7.5,5);
\coordinate (D) at (7.5,0);
\draw(A)--(B)--(C)--(D)--cycle;
%标注xy
\coordinate [label=left:$\frac{\theta}{\theta _{0}}$](E) at ($(B)+(-0.4,-0.2)$);
\coordinate [label=below:$Bi \cdot Fo $](F) at ($(D)+(-0.2,-0.4)$);
%绘制ticker
\foreach \i/\texti  in {1,2,3,4,5} {
\draw (1.5*\i,0) --(1.5*\i,\ticker) node[label=below:\texti]{};
}
\foreach \j/\textj  in {0.2,0.4,0.6,0.8,1.0} {
\draw (0,5*\j) --(\ticker,5*\j) node[label=left:\textj]{};
}
%绘制miniticker
\foreach \i  in {0.5,1.5,...,4.5} {
\draw (1.5*\i,0) --(1.5*\i,0.8*\ticker);
}
\foreach \j  in {0.1,0.3,...,0.9} {
\draw (0,5*\j) --(0.8*\ticker,5*\j);
}
%画曲线
%\draw(B)parabola[bend at end](D);
\draw[name path = pathcurve] (B)..controls ($(A)+(1,0)$)and ($(A)+(4.5,1)$)..($(D)+(0,+0.2)$);
\coordinate (G) at (0,0.368*5);
%绘制交点H
\path[name path = pathGLine](G)--($(G)+(10,0)$) ; %只定义,不绘制线
\path[draw,fill,name intersections={of = pathGLine and pathcurve,by=H}](H)circle(1pt);
\draw (G)--(H)|-(A);
%标注字符
{\tiny
\coordinate[label=below:$36.8 \% $] (I) at ($(G)!0.5!(H)$); %线段GH的中点为($(G)!0.5!(H)$)
}
%绘制箭头
\draw [->](I)--+(-0.5,0);
\draw [->](H)--($(A)!(H)!(D)!0.5!(H)$); %过H点做AD的垂线,垂足为($(A)!(H)!(D)$)
\end{tikzpicture}
}%
\end{document}
选自:http://blog.csdn.net/rumswell/article/details/8776934


发表评论 取消回复