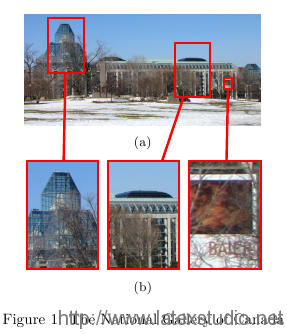
在论文写作中插图时,时常需要对插入图片的细节进行说明,此时通常采用的做法是对图像局部进行放大,并将细节图再与原图进行关联。该问题用语言描述较为困难,具体可看如下的效果图
 在 LaTeX 中如何实现该效果呢?从该图可以看出,实现该效果可以通过以下三步完成:
- 插入原图,并绘制标注框。
- 插入局部放大子图。
- 绘制局部图与标志区域关联线。
\documentclass{article}
\usepackage{mwe,subcaption,tikz}
%\usepackage{subfigure}
\tikzset{boximg/.style={remember picture,red,thick,draw,inner sep=0pt,outer sep=0pt}}

\begin{document}
	\begin{figure}
 		\centering
 			%插入原图
 			\begin{subfigure}{.55\linewidth}
   			\begin{tikzpicture}[boximg]
   			\node[anchor=south west] (img) {\includegraphics[width=\linewidth]{example-image}};
   				\begin{scope}[x={(img.south east)},y={(img.north west)}]
       		% 建立相对坐标系,辅助标注框定位
       		\draw[help lines,xstep=.1,ystep=.1] (0,0) grid (1,1);
      			\foreach \x in {0,1,...,9} { \node [anchor=north] at (\x/10,0) {0.\x}; }
       		\foreach \y in {1,...,9} { \node [anchor=east] at (0,\y/10) {0.\y}; }
   				\end{scope}

   				\begin{scope}[x=(img.south east),y=(img.north west)]
       		\node[draw,minimum height=1.6cm,minimum width=1.00cm] (B1) at (0.2,0.60) {};
       		\node[draw,minimum height=0.8cm,minimum width=0.50cm] (B2) at (0.7,0.25) {};
       		\node[draw,minimum height=0.4cm,minimum width=0.25cm] (B3) at (0.9,0.10) {};
   				\end{scope}
   			\end{tikzpicture}
   		\caption{}
 			\end{subfigure}\\[0.5\baselineskip]

 			%插入图片局部放大图
 			\begin{subfigure}{.55\linewidth}
   			\begin{tikzpicture}[boximg]
     				\node (img1) {\includegraphics[width=0.3\linewidth]{example-image-10x16}};
     				\draw (img1.south west) rectangle (img1.north east);
   			\end{tikzpicture}\hfill%
   			\begin{tikzpicture}[boximg]
     				\node (img2) {\includegraphics[width=0.3\linewidth]{example-image-10x16}};
     				\draw (img2.south west) rectangle (img2.north east);
   			\end{tikzpicture}\hfill%

   			\begin{tikzpicture}[boximg]
    	 			\node (img3) {\includegraphics[width=0.3\linewidth]{example-image-10x16}};
     				\draw (img3.south west) rectangle (img3.north east);
   			\end{tikzpicture}
  			\caption{}
	 		\end{subfigure}

	 	% 绘制连接性
	\begin{tikzpicture}[overlay,boximg]
   		\draw (B1) -- (img1);
   		\draw (B2) -- (img2);
   		\draw (B3) -- (img3);
 		\end{tikzpicture}
 	\caption{Connection to Subfigure}
\end{figure}
\end{document}
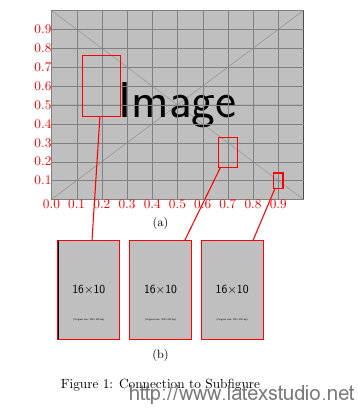
效果如图:
 解决该问题的主要方法是,将插入的图片,以及标注框都在tikz中绘制为node,再通过绘制不同node的连线来关联图像。另外,在文中在绘制标注框时,为了方便确定标注框的位置,绘制了网格线辅助绘图,在绘制完毕后可以删除。
参考博文
借助 TikZ 在已有的图上绘图 How to add a zoombox effect to different images?选自:http://wangmurong.org.cn/2015/04/29/how-to-connect-subfigure/


发表评论 取消回复