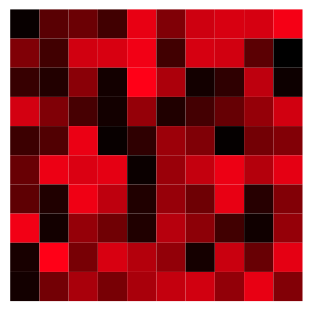
代码实现
\documentclass[12pt]{article}
\usepackage{tikz}
\usepackage{collcell}

\newcommand*{\MinNumber}{0}%
\newcommand*{\MaxNumber}{1}%

\newcommand{\ApplyGradient}[1]{%
\pgfmathsetmacro{\PercentColor}{100.0*(#1-\MinNumber)/(\MaxNumber-\MinNumber)}
\hspace{-0.33em}\colorbox{red!\PercentColor!black}{}
}

\newcolumntype{R}{>{\collectcell\ApplyGradient}c<{\endcollectcell}}
\renewcommand{\arraystretch}{0}
\setlength{\fboxsep}{3mm} % box size
\setlength{\tabcolsep}{0pt}

\begin{document}
\begin{table}[ht]
\begin{center}
\begin{tabular}{*{10}{R}}
0.03 & 0.34 & 0.41 & 0.25 & 0.89 & 0.49 & 0.79 & 0.83 & 0.82 & 0.94 \\
0.49 & 0.25 & 0.80 & 0.83 & 0.93 & 0.25 & 0.82 & 0.80 & 0.35 & 0.00 \\
0.21 & 0.13 & 0.53 & 0.07 & 1.00 & 0.66 & 0.07 & 0.18 & 0.73 & 0.05 \\
0.81 & 0.49 & 0.27 & 0.07 & 0.57 & 0.12 & 0.26 & 0.39 & 0.57 & 0.80 \\
0.23 & 0.31 & 0.90 & 0.03 & 0.18 & 0.60 & 0.49 & 0.02 & 0.44 & 0.50 \\
0.40 & 0.91 & 0.84 & 0.88 & 0.04 & 0.59 & 0.75 & 0.91 & 0.69 & 0.88 \\
0.36 & 0.12 & 0.92 & 0.73 & 0.12 & 0.58 & 0.42 & 0.89 & 0.15 & 0.50 \\
0.93 & 0.07 & 0.57 & 0.43 & 0.12 & 0.70 & 0.54 & 0.25 & 0.06 & 0.57 \\
0.09 & 0.98 & 0.46 & 0.83 & 0.69 & 0.56 & 0.08 & 0.77 & 0.40 & 0.88 \\
0.07 & 0.44 & 0.65 & 0.46 & 0.65 & 0.75 & 0.80 & 0.56 & 0.89 & 0.50 \\
\end{tabular}
\end{center}
\end{table}
\end{document}选自:http://texblog.org/2013/06/13/latex-heatmap-using-tabular/


发表评论 取消回复