问题提出
很多时候我们需要绘制一条曲线的切线,主要有两类情况:
- 已知曲线的表达式,这种情况相对简单一点,只需算出曲线的一阶导函数,并且计算出切点坐标,在切点处将一阶导函数画出即可。
- 曲线是由一些点构成,比如贝泽尔曲线或者由一些点顺次连接起来的光滑曲线,由于未知函数表达式,所以坐标得不到,切线斜率更难得到。
使用 TikZ 绘制已知表达式曲线的切线
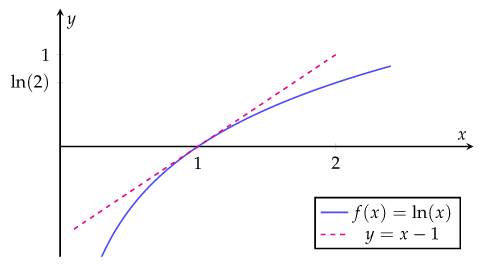
这里给出一个例子,我们 使用到的工具依然是 TikZ,比如我们需要画出 ln(x) 在(1,0) 处的切线,使用到的代码如下:
 %!TEX program = pdflatex
\documentclass{article}

\usepackage{mathpazo}
\usepackage{tikz,pgfplots}
\pgfplotsset{compat=1.8}

\begin{document}

\begin{tikzpicture}
\begin{axis}[
    legend pos=south east,
    y=2cm, x=3cm,
    xlabel={$x$}, ylabel={$y$},
    xmin=0, xmax=3,
    ymin=-1.2, ymax=1.5,
    xtick={0,1,2}, ytick={0,0.6931471806,1},
    xticklabels={0,1,2}, yticklabels={0, $\ln(2)$,1},
    line width=1pt,
    axis lines=center,
    ]
    \addplot [smooth, domain=0.2:2.4, blue!70] {ln(x)};
    \addlegendentry{$f(x) = \ln(x)$}
    \addplot [smooth, domain=0.1:2.0, magenta, dashed] {x-1};
    \addlegendentry{$y = x - 1$}
\end{axis}
\end{tikzpicture}

\end{document}
显示效果如下:
使用 TikZ 绘制未知表达式曲线的切线
一、使用 markings 实现对点的定位
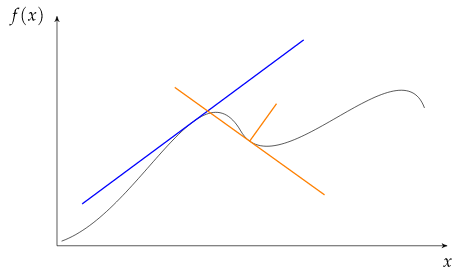
这里提供一个例子: %!TEX program = pdflatex
\documentclass{article}
\usepackage{tikz}
\usepackage{mathpazo}
\usetikzlibrary{arrows}
\usetikzlibrary{decorations.markings}
\begin{document}
\begin{tikzpicture}[
tangent/.style={
decoration={
markings,% switch on markings
mark=
at position #1
with
{
\coordinate (tangent point-\pgfkeysvalueof{/pgf/decoration/mark info/sequence number}) at (0pt,0pt);
\coordinate (tangent unit vector-\pgfkeysvalueof{/pgf/decoration/mark info/sequence number}) at (1,0pt);
\coordinate (tangent orthogonal unit vector-\pgfkeysvalueof{/pgf/decoration/mark info/sequence number}) at (0pt,1);
}
},
postaction=decorate
},
use tangent/.style={
shift=(tangent point-#1),
x=(tangent unit vector-#1),
y=(tangent orthogonal unit vector-#1)
},
use tangent/.default=1
]
\draw [<->,>=stealth'] (0,5) node [label = left:{$f(x)$}]{} -- (0,0) -- (8.5,0) node[label = below:{$x$}]{};
\draw [
tangent=0.4,
tangent=0.56,
] (0.1,0.1)
to [out=20,in=120] (4,2.5)
to [out=-60, in=110] (8,3);
\draw [blue, thick, use tangent] (-3,0) -- (3,0);
\draw [orange, thick, use tangent=2] (-2,0) -- (2,0) (0,0) -- (0,1);
\end{tikzpicture}
\end{document}
效果如下:
二、使用 node 作为初始点新建局部的坐标系
 %!TEX program = pdflatex
\documentclass{article}

\usepackage{tikz}
\usepackage{mathpazo}
\usetikzlibrary{arrows,calc}

\begin{document}

\begin{tikzpicture}[allow upside down,scale=0.7]
\draw [<->,>=stealth'] (0,5.5) node [label = left:{$f(x)$}]{} -- (0,0) -- (9,0) node[label = below:{$x$}]{};

 % 将路径画出来,然后选择切点位置为 0.5
\draw[black,line width=1pt] (0,0) .. controls (5,1) and  (6,2) .. (8,5)
      node[sloped,inner sep=0cm,above,pos=0.5,
      anchor=south west,
      minimum height=(10.5)*0.3cm,minimum width=(10.5)*.3cm](N){};
 % 绕 N 建立局部的参照点
\path (N.south west)%
           edge[-stealth',blue] node[left] {$\vec{ n}$} (N.north west)
           edge[-stealth',blue] node[above] {$\vec{ t}$} (N.south east);
\path [draw,magenta,thick,dashed](N.south east)--(N.south west) -- ($(N.south west)!1!180:(N.south east)$);

 % 灰色线为点 N 所在垂直的直角坐标系
\draw[-stealth',gray]  (N.south west)  --%
      node[below] {$\vec{t_a}$} (N.south west -| N.south east);
\draw[-stealth',gray]  (N.south west)  --%
      node[right] {$\vec{t_o}$} (N.south west |- N.south east);

\end{tikzpicture}

\end{document}
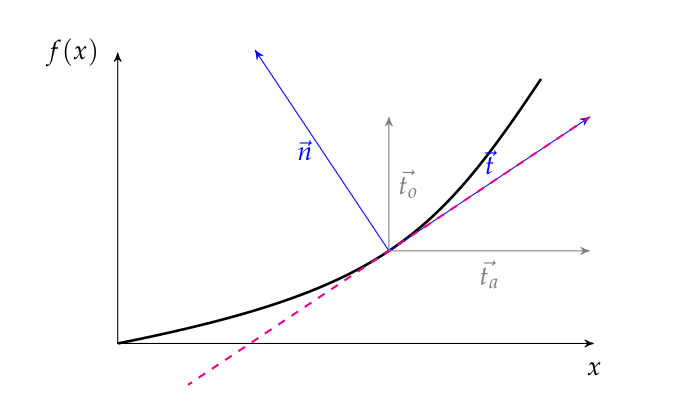
效果图如下所示:
注意事项:
由于对于未知表达式的曲线而言,想要确切知道切点的坐标并不容易,在我们选择切点的时候使用的是相对整个路径的比率,比如 tangent = 0.4 或者 pos = 0.5 都是相对比例,并且这个比例必须要在 0-1 之间,不含边界。
原帖地址:


发表评论 取消回复