问题提出
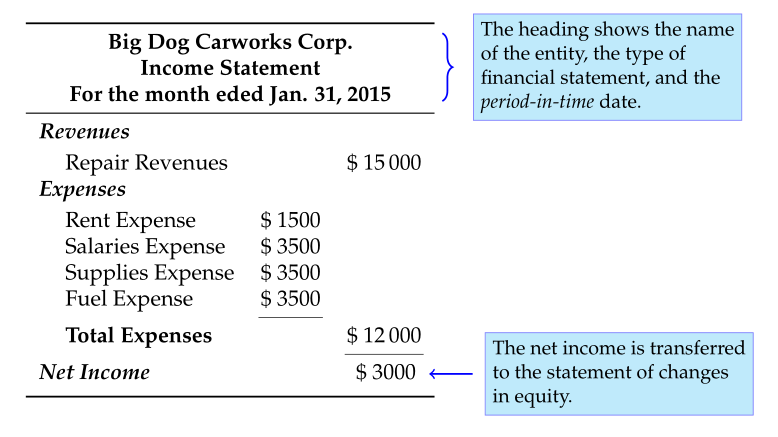
提问者想实现对一个会计表格的解释性修饰,一个示例如下。图形左侧为一个表格,右侧为辅助性的修饰。
问题解决
要实现如图所示的效果,关键是定位,以及花括号的放置!Peter Grill 给出了一个很好的方法。他使用了 \tikzmark ,借助 \tikzmark ,只需三步就可以实现定位显示:
- 正常输入表格环境以及内容
- 在需要标注的点使用 \tikzmark
- 使用 [overlay,remember picture] 选项的 tikzpicture 环境使用 \tikzmark
 %!TEX program = pdflatex

\documentclass{article}

\usepackage{tikz}
\usetikzlibrary{decorations.pathreplacing}
\usepackage{siunitx}
\usepackage{booktabs}
\usepackage{mathpazo}

\newcommand{\bfit}[1]{\textbf{\textit{#1}}}

\newcommand{\tikzmark}[1]{\tikz[overlay,remember picture] \node[baseline] (#1) {};}

\tikzset{My Node Style/.style={midway, right, xshift=3.0ex, align=left, font=\small, draw=blue!50, thin, fill=cyan!25, text=black}}

\newcommand\VerticalBrace[4][]{%
    % #1 = draw options
    % #2 = top mark
    % #2 = bottom mark
    % #4 = label
  \draw[decorate,decoration={brace, amplitude=1ex}, #1]
    ([yshift=1.5ex]#2.east)  -- (#3.east)
        node[My Node Style] {#4};
}

\newcommand\DrawArrow[3][]{%
    % #1 = draw options
    % #2 = mark
    % #3 = label
  \draw[<-, shorten >=0.1cm, #1]
    ([shift={(0.0cm,0.5ex)}]#2.east)  -- ([shift={(0.8cm,0.5ex)}]#2.east)
        node[My Node Style] {#3};
}

\begin{document}

\begin{tabular}{llrr}
 \toprule
 \multicolumn{4}{c}{\textbf{Big Dog Carworks Corp.}} \tikzmark{Heading Top}\\
 \multicolumn{4}{c}{\textbf{Income Statement}} \\
 \multicolumn{4}{c}{\textbf{For the month eded Jan. 31, 2015}}\tikzmark{Heading Bottom}\\
 \midrule
 \multicolumn{2}{l}{\bfit{Revenues}} \\[0.5ex]
    & Repair Revenues         && \$ \num{15000} \\
 \multicolumn{2}{l}{\bfit{Expenses}} \\[0.5ex]
    & Rent Expense     & \$ \num{1500} \\
    & Salaries Expense & \$ \num{3500} \\
    & Supplies Expense & \$ \num{3500} \\
    & Fuel Expense     & \$ \num{3500} \\
    \cmidrule(lr){3-3}
    & \textbf{Total Expenses} && \$ \num{12000} \\
    \cmidrule(lr){4-4}
 \multicolumn{2}{l}{\bfit{Net Income}} &&\$ \num{03000} \tikzmark{Net Income Mark}\\[0.5ex]
 \bottomrule
\end{tabular}


\begin{tikzpicture}[overlay,remember picture]
    \VerticalBrace[thick, blue]{Heading Top}{Heading Bottom}{%
        The heading shows the name \\
        of the entity, the type of \\
        financial statement, and the \\
        \textit{period-in-time} date.%
    }
    \DrawArrow[thick,blue]{Net Income Mark}{%
        The net income is transferred \\
        to the statement of changes \\
        in equity.%
    }
\end{tikzpicture}

\end{document}
效果如下:
 原帖地址:http://tex.stackexchange.com/questions/182639/combining-tables-and-tikz
选自:http://elegantlatex.org/2014/06/02/tikz-and-table/


发表评论 取消回复